


- Home
- The Frontline Reporting Index 2027
Research · Framework edition
The Frontline Reporting Index 2027
The work-to-record gap. How much work it takes to produce a safety record someone else can use, and what the organisation can do with it.
- 17 pages
- PDF, 1.2 MB
- Published October 2026
- Free
The central question
How much work does it take to produce a useful record, and what can the organisation do with it?
The work-to-record gap
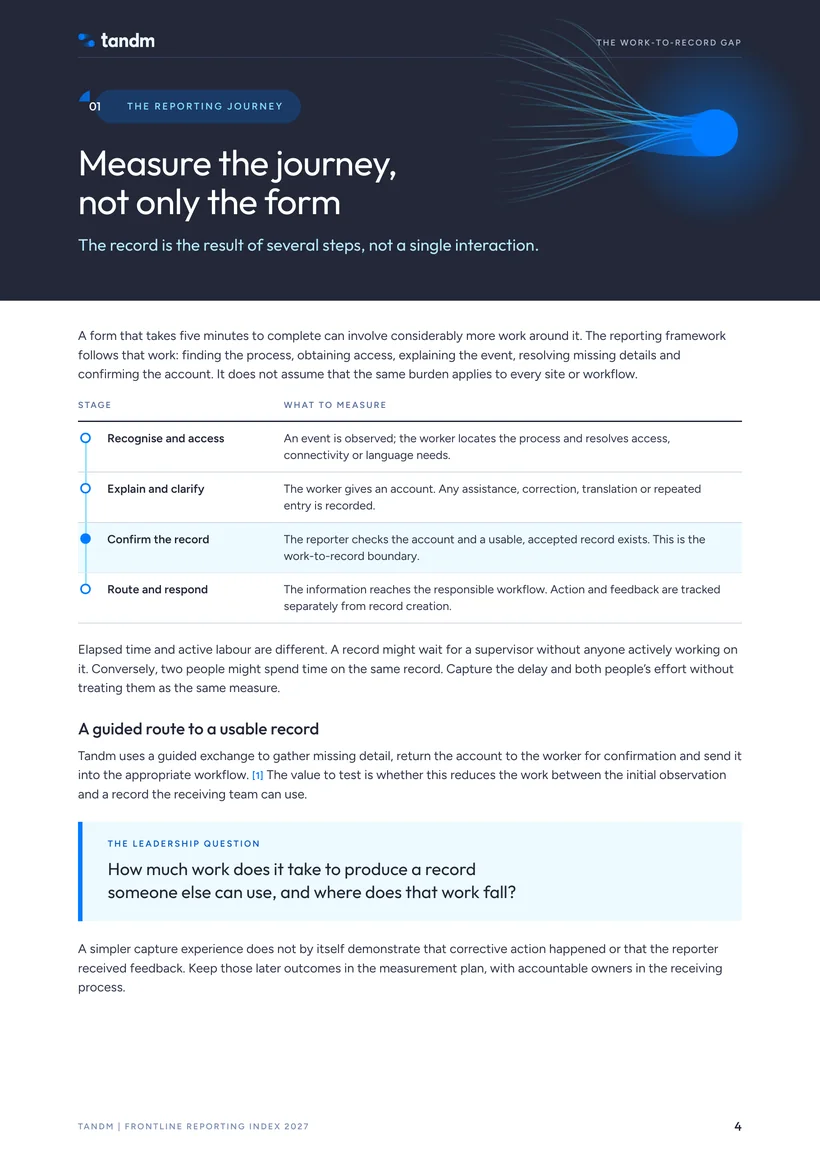
The work-to-record gap is the distance between what someone knows at the point of work and what the organisation can reliably use. It includes the minutes spent reporting, the help needed to complete the task, the detail recovered later and the handoffs before anyone can act.
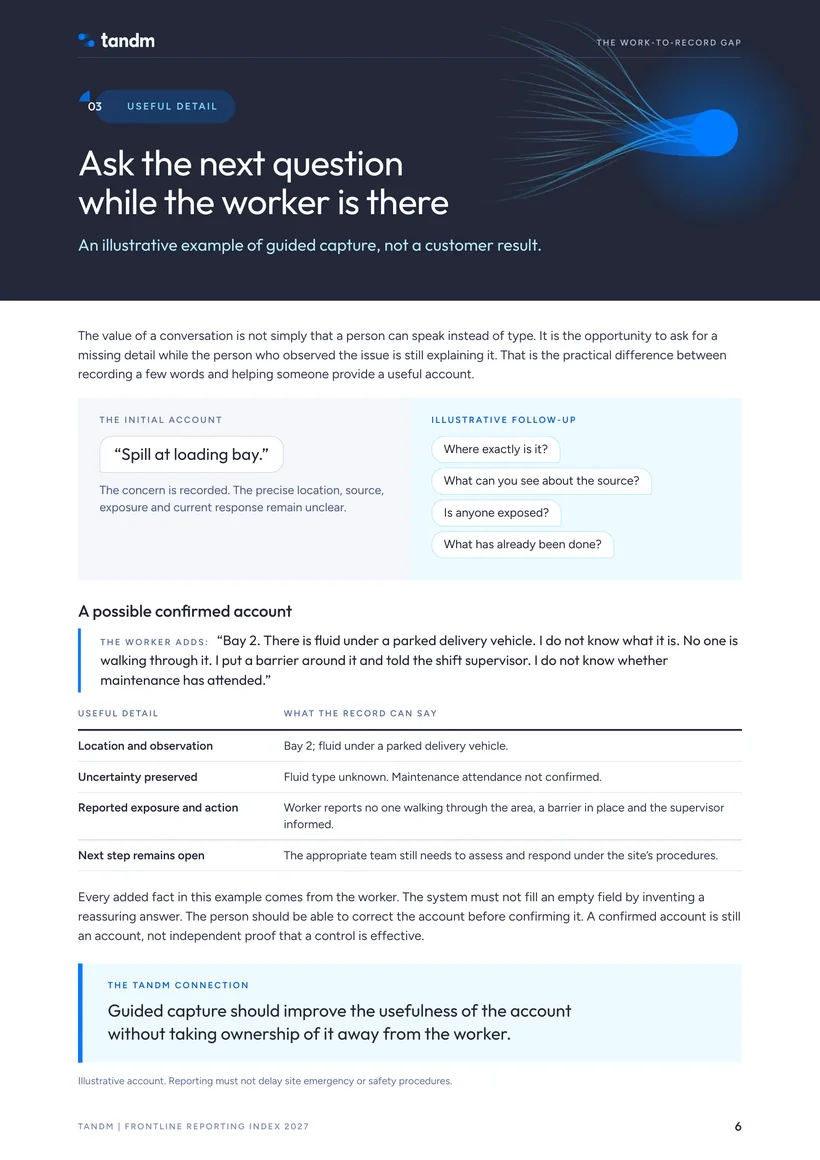
The aim is not to produce more words. It is to capture the information the next person actually needs, with less work for the person providing it.
Tandm’s point of view, from the report
Five outcomes to examine
What a better reporting process should change.
Time and capacity
Less effort across the complete reporting task.
Participation
Workers able to provide their own account in a usable language and channel.
Useful detail
Information that survives the move into a formal record.
Control and audit evidence
A clearer account of what was checked and what remains open.
Better-informed decisions
Records that support investigation and comparison rather than simply adding another entry.
Inside the report
An operational framework for frontline reporting and its business case.
In the report, Tandm looks at how frontline observations become usable safety records, and connects the effort required to create a record with the usefulness of the information the organisation receives.
- 3Executive perspective
- 4–5The reporting journey and time and capacity
- 6–7Useful detail, participation and language
- 8–10Control evidence, audit follow-through and usable information
- 11Where Tandm fits
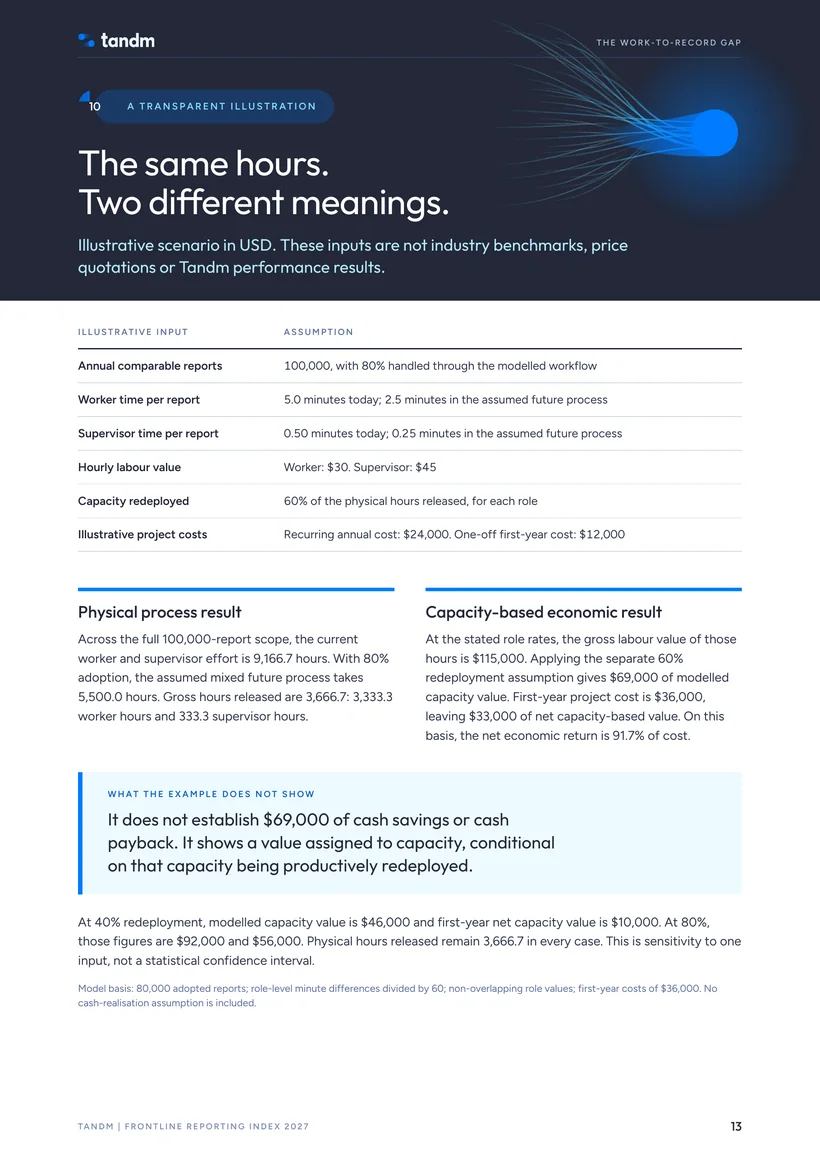
- 12–13The business case and a transparent ROI illustration
- 14–15Pilot evaluation and your operation
- 16–17Measurement framework, report basis and sources
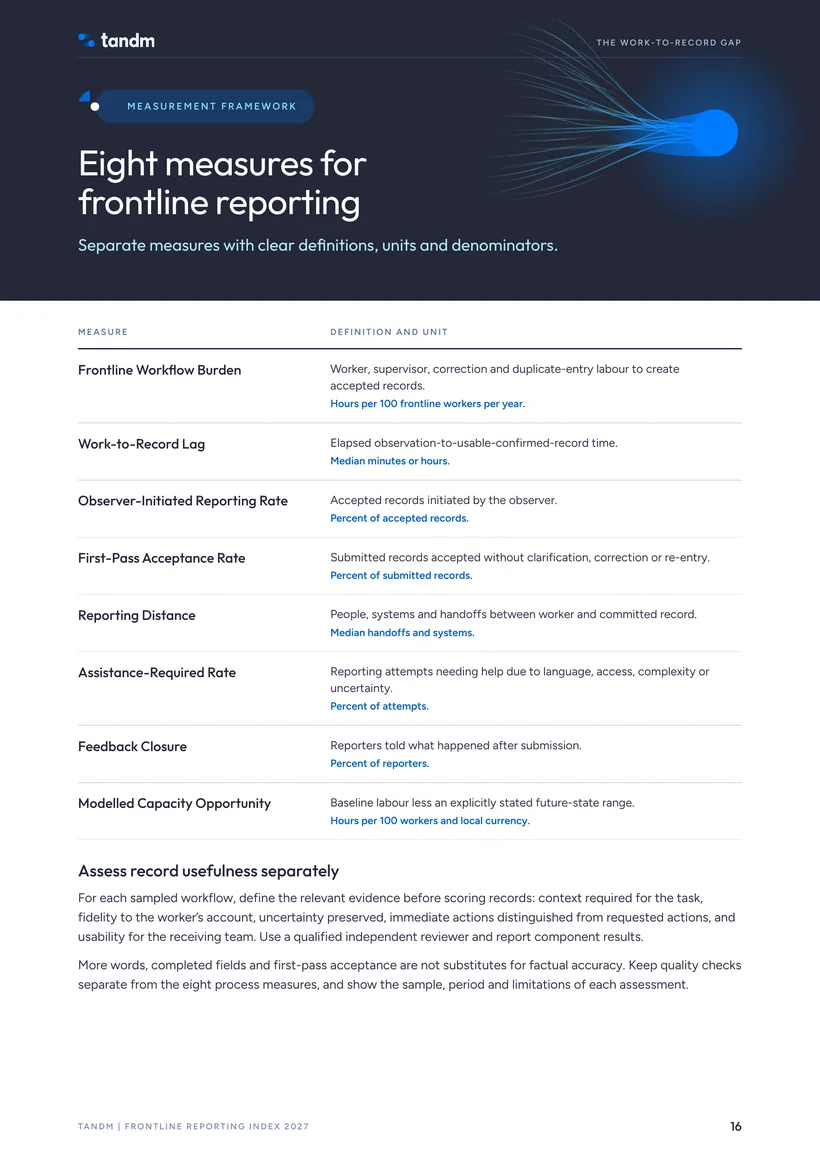
Measurement framework
Eight measures for frontline reporting
Separate measures with clear definitions, units and denominators.
- 01
Frontline Workflow Burden
Worker, supervisor, correction and duplicate-entry labour to create accepted records.
Hours per 100 frontline workers per year.
- 02
Work-to-Record Lag
Elapsed observation-to-usable-confirmed-record time.
Median minutes or hours.
- 03
Observer-Initiated Reporting Rate
Accepted records initiated by the observer.
Percent of accepted records.
- 04
First-Pass Acceptance Rate
Submitted records accepted without clarification, correction or re-entry.
Percent of submitted records.
- 05
Reporting Distance
People, systems and handoffs between worker and committed record.
Median handoffs and systems.
- 06
Assistance-Required Rate
Reporting attempts needing help due to language, access, complexity or uncertainty.
Percent of attempts.
- 07
Feedback Closure
Reporters told what happened after submission.
Percent of reporters.
- 08
Modelled Capacity Opportunity
Baseline labour less an explicitly stated future-state range.
Hours per 100 workers and local currency.
The index is this set of eight measures. There is no composite score. In the report, Tandm also sets out how to assess record usefulness separately, with a qualified independent reviewer.
Get the reportThe business case
Put numbers on the work. Keep the wider value visible.
A credible business case does not need to assign a price to every benefit. Estimate the economic value from an agreed baseline. Put the operational reasons for change beside that calculation, with a clear way to test them.
Lane 1 · Modelled economics
Use actual workflow volumes, time by role, labour rates, adoption and full project costs. Distinguish economic capacity value from identifiable cash savings.
Lane 2 · Operational value
Track useful detail, assistance, confidence in the account, control evidence, audit preparation and readiness for analysis. Do not automatically convert these to money.
The finance boundary
Released capacity is not automatically cash saved. A positive capacity-based business case can still require additional cash expenditure.
Run your own numbers
Two questions, and the reporting time across your workforce in hours. The report includes a transparent ROI illustration with every input visible; its inputs are illustrative assumptions, with no benchmark or customer data in them.
People who complete safety forms. Type a larger number if the slider does not reach.
This replaces the headcount and frequency estimate. One form completed for a whole crew counts once.
Hours only on this page. The cost side needs your rates, so we go through it with you.
The calculator applies two further allowances to the time. The report’s example applies a redeployment factor to the value instead. Both are planning assumptions to test in a pilot.
How we count. This page assumes half the form time comes out, counts three quarters of that, then removes a further 15%. Planning assumptions to test in a pilot, not measured results. Injuries avoided, fines, insurance premiums, anything reputational, and setup, devices and rollout are all left out.
About this edition
This is a framework edition of the Frontline Reporting Index, not a statistical benchmark. It presents a measurement framework and a constructed ROI example. It does not report completed survey findings or measured customer outcomes. The examples are clearly identified throughout.
Public sources cited: UK Health and Safety Executive, Developing process safety indicators (HSG254). Canadian Centre for Occupational Health and Safety, Incident Investigation.
Tandm publishes this report and provides the product described. References to external guidance do not imply endorsement by the source organisations.

The report
Make the case with your own figures.
The report defines the questions. Your operation supplies the answers.